
 Have a question? +971 56 404 0503





Tech Features
Digitalizing Fuel Efficiency over Engine Efficiency: Integrating Technology to Measure Consumption


By: Rob Mortimer, Director, Fuelre4m
Modern ships are already starting to bristle with technology to measure vessel efficiency, yet one thing stands out over all the results, tech and noise. The importance of the efficiency of fuel isn’t quite understood or calculated. You’ll hear reference back to SFOC (Specific Fuel Oil Consumption) at any time fuel consumption is measured, yet while the principal is right, the measuring and calculating is far from ideal.
Heavy Fuel Oil has an energy density of between 39MJ/kg and 42MJ/kg when burnt. That’s a wide range and depends very much on the source and quality of the fuel. How is it stored, transferred, settled, heated and purified to remove pollutants, particulate, water and reduce the ‘drop’ size to help with better atomisation when introduced into the engine. Large drops of fuel don’t fully combust in the engine. They undergo secondary combustion and turn into heat energy and emissions. Our goal, and what should be the goal of the whole shipping industry, irrelevant of fuel, vessel size and function, should be to be able to account for every drop of fuel consumed.
The Fuel System Lockdown:
MFM Bunker to Bunker
The first challenge is to know and agree what is being bunkered onto the vessel in the first place. To know the mass of the bunker, we must be using a correctly ranged Mass Flow Meter.
MFM Bunker to Settling Tank
When using Fuelre4m’s Re4mx Fueloil re4mulator, we need to dose the correct amount of product for the weight of fuel that is being treated either in the bunker or in the settling tank.
MFM Settling to Purification
Having a mass flow meter after the settling and before purification isn’t wholly necessary, but can be beneficial in understanding the temperature and density of transferred fuel, as well as understanding what the percentage of water and waste material has been lost to this point.
MFM Before Mixing Column, Pre Main Engine – Fuel In
This is the last reference check point of the fuel before it is injected into the engine. What will be reported as accurately as possible from this point will be how much fuel by weight is now passing through for combustion.
MFM Post Main Engine – Fuel Out
To understand the fuel consumption of the main engine, it’s important to be able to measure as close to the Fuel In and Fuel Out points as possible. Fuel consumption of the Main Engine should be as simple as MFM IN minus MFM OUT.
Torque / Shaft Power Meter
So, we’ve locked down the mass of the fuel flowing into the engine, now how do we measure the power produced? Despite how it sounds, a torque meter does not measure torque. It simply measures time and distance. As forces against the propellor change, the amount of power needed to maintain the same turning speed will also change, and the propellor shaft with ‘twist’ with torque.
Why is the ranging important? Because the maximum power rating of the engine changes depending on the quality of the fuel and the energy it can release.
If your fuel produces 1kWh for 160g, 1000kg of fuel will produce 6,250kWh of power. If your fuel produces 1kWh for 180g, 1000kg of fuel will produce only 5,550kWh of power. If the maximum Fuel In capacity of the engine, from where the power rating is calculated, is 1000kg, your maximum power rating of that engine, and with it, the SFOC, has now changed.
Power Cards / Power Curves
The taking of indicator cards, allows the ship’s engineer to receive more information about the combustion process (via the draw or out of phase card), measure the cylinder power output of the engine (via the power cards), and check the cleanliness of the scavenging process (via the light spring diagram).
For the purposes of measuring the efficiency of the fuel, the power cards can be used to calculate the energy release of the fuel. This can then be used to build an algorithm to ‘range’ or adjust the power readings from the torque meter to the quality of the fuel.
MFM Auxiliary Engines – Fuel In
The auxiliary engines, strangely, are probably the easiest to prove fuel efficiency and the efficiency of the fuel on. Why? Because they’re generating electrical power that can easily be measured.
MFM Auxiliary Engines – Fuel In
A common fuel flow in and fuel flow out MFM will suffice if all of the auxiliary engines are sharing a common fuel flow system.
Auxiliary Engines – Constant Power Meter
Being able to monitor the amount of power produced at a given moment is not enough. Electrical loads can vary, and at the time once an hour that the kW reading is taken, or the kWh counter is recorded, the load just two seconds later could change. The fuel consumption for 100kWh over 3 minutes is vastly different than 100kWh over 1 hour.
Boilers & Cargo Offload Systems
Some vessels use boilers to generate steam power, running off the same fuel as the main engines. It is important to lock down all fuel consumers to understand where the fuel is being consumed.
MFM Boiler – Fuel In
Often fed straight from the settling tank without needing to go through further purification, the boiler directly combusts the fuel to generate steam from water.
To be able to calculate the boiler and fuel efficiency, we now need to firstly look at how much fuel in mass is being consumed.
Volumetric or MFM – Water In
Fresh water has a very well-known density of 1g per ml, but this is also affected by temperature. The use of a temperature compensated mass flow meter will improve accuracy of water used to produce the required steam.
Recordable Pressure Gauge
The last variable? How much water and fuel is being used to produce the same amount of steam pressure.













Kayvan Karim, Programme Director of MSc Software Engineering, School of Mathematical and Computer Sciences, Heriot-Watt University Dubai
For the past few years, the AI infrastructure race has largely been measured in scale: more GPUs, larger data centres and greater power capacity. That expansion is continuing, but the economics are beginning to change. Competitive advantage may increasingly depend not only on securing additional power, but on extracting more useful AI work from the power already available. Part of the reason is a change like AI demand. We are moving from relatively simple prompt-and-response systems towards agents that can reason across multiple steps, call tools, inspect results, revise plans and continue working autonomously. Anthropic’s latest Economic Index notes that Claude usage is increasingly shifting towards long-running agentic tasks and that more computationally intensive conversations tend to be associated with higher-value outputs.
This transition could have significant implications for infrastructure demand. A chatbot might generate one answer to one prompt. An agent performing a software-development, research or business task may invoke a model dozens of times, maintain a large context, call external tools and generate many intermediate reasoning steps before producing an outcome. Demand may therefore grow in two ways: more people using AI and more inference, model calls, and tokens processed for each task. Major AI laboratories are already working on this efficiency problem. OpenAI says one of its primary inference objectives is to serve more tokens from the same hardware, using techniques including scheduling, caching, kernel optimisation and improved model implementation. It also describes GPT-5.6 as being trained to accomplish more work per token. Google DeepMind is pursuing a similar direction: its Gemini 3.6 Flash was designed for scaled agentic workloads and uses fewer output tokens than its predecessor on several evaluations. In contrast, its recent agentic video system reduced token consumption by up to 88% for that workload.
Other approaches address efficiency at the model architecture level. DeepSeek-V3, for example, uses a Mixture-of-Experts design with 671 billion total parameters but activates 37 billion per token, so only part of the network is used for each computation. Meta has similarly worked on inference efficiency through grouped-query attention and more efficient tokenisation; the Llama 3 tokeniser was reported to require up to 15% fewer tokens than Llama 2 for equivalent text. Taken together, these approaches show that model capability is increasingly being developed alongside the cost of delivering it.
Model-level efficiency, however, is unlikely to remove the infrastructure constraint on its own. Global data-centre electricity consumption was approximately 415 TWh in 2024, according to the International Energy Agency, and its base case projects this to reach around 945 TWh by 2030. AI is expected to drive most of that growth. Efficiency is therefore improving while aggregate demand continues to rise. One reason is the Jevons, or rebound, effect: efficiency improvements reduce the resources required for each unit of work, but lower costs can also encourage greater overall use. If agents become much cheaper to operate, organisations may respond by deploying more of them, running them for longer, or applying them to tasks that were previously uneconomic. Efficiency can reduce the compute required for an individual task while still increasing total demand.
That increased demand meets infrastructure that cannot expand as quickly. Models and software can improve quickly, but grids, substations, transformers and power-generation infrastructure usually have much longer development cycles. The IEA notes that while a data centre can sometimes be developed within two or three years, the broader energy infrastructure required to support it often involves longer planning and construction periods. Where grid capacity is constrained, each available megawatt becomes a more valuable production resource. The amount of power available remains important, but so does the amount of useful computation that can be produced within that power envelope.
That changes how we should understand capacity. Improvements in accelerator performance, model architecture, workload scheduling, caching, utilisation and inference software can increase computational output without increasing a site’s electrical connection. OpenAI’s recently reported Jalapeño inference hardware illustrates the direction of travel: the company says the chip can deliver more AI work per unit of power while increasing throughput and reducing latency. Efficiency can therefore act as a form of virtual capacity. If two operators each control 100 MW, but one can consistently deliver substantially more useful AI work within that power envelope, their nominal capacity may be identical while their productive capacity is not.
The same constraint applies to physical space and cooling. AI systems are concentrating more computational power into individual racks, increasing both power density and heat output. Packing more accelerators into the same building only creates useful capacity if the electrical and thermal infrastructure can support them. This is one reason liquid cooling is moving from a specialist technology towards a more central part of AI data-centre design. Microsoft, for example, has introduced a closed-loop chip-level cooling architecture that it says eliminates evaporative water consumption for cooling and could avoid more than 125 million litres of water annually per data centre. The example also shows why power, cooling, water use and rack density cannot be treated independently.
The same shift creates a measurement problem. Power Usage Effectiveness, or PUE, has been valuable for showing how much facility energy is required beyond the electricity IT equipment consumes. It does not, however, measure whether that IT equipment is producing useful work efficiently. Uptime Institute’s 2025 survey placed average PUE at around 1.54 and noted that the headline industry figure had changed little for six years. Uptime has consequently argued for productivity measures that relate computational work to energy consumption. For AI inference, tokens per kilowatt-hour might offer one operational measure. Still, even that is incomplete: an efficient model that solves a task in 1,000 tokens may be more valuable than one generating 10,000. A more useful long-term measure may therefore be useful AI work per unit of energy, water and infrastructure.
Capacity will remain essential. The AI industry will continue to build larger data centres, secure new power supplies and deploy large quantities of computing hardware. As agentic systems create more persistent inference demand and physical resources become harder to expand, however, efficiency may increasingly determine the productive value of that capacity. Operators that can support more useful computation within the same power, cooling, water, and space constraints can accommodate more workloads without waiting for equivalent growth in physical infrastructure.
For AI infrastructure, installed megawatts will remain a headline measure. The more consequential measure may increasingly be how much useful AI work those megawatts can support.
Tech Features
TrendAI™Expands Vision One with New Security Capabilities for AI Agents and Application Development

TrendAI™, the global AI security leader and enterprise business unit of Trend Micro Incorporated (TYO: 4704; TSE: 4704), has announced new capabilities for TrendAI Vision One™. These include the private preview of Autonomous Vulnerability Discovery and expanded support for Claude’s Compliance API, which now covers Claude Code and Cowork sessions. Together, these services help enterprises identify exploitable vulnerabilities in source code before attackers do, investigate how AI agents operate, and maintain oversight as AI adoption scales.
The need for this oversight is growing rapidly across the region. According to research conducted by The Harris Poll for Dataiku, 62% of UAE chief information officers believe their organisation have more than 50 AI agents running in production, yet only 18% have a fully unified view of agents across platforms, data environments, and business applications. At the same time, AI is accelerating both how quickly code is written and how quickly attackers can identify flaws. Security teams therefore need to keep pace with AI adoption without losing visibility into what is happening across their environments.
The new capabilities extend TrendAI Vision One™ across both software development and AI agent activity. TrendAI Vision One™ Autonomous Vulnerability Discovery is powered by AESIR, TrendAI’s agentic exploit-remediation engine, which identifies and validates vulnerabilities, including zero-days. It also verifies fixes in customer source code. The engine uses purpose-built, multi-model AI architecture that relies primarily on Anthropic models and has outperformed single-model and agentic system scores on the CyberGym Leaderboard. Every finding is validated by experts from the TrendAI™ Zero-Day Initiative™ (ZDI), the world’s largest vendor-agnostic bug bounty programme. The Autonomous Vulnerability Discovery is deployed and operated on Amazon Bedrock from Amazon Web Services (AWS), enabling the full workflow to run within the customer’s AWS environment
In parallel, the expanded Claude Compliance API integration brings Claude Code and Cowork session records from Claude Enterprise into TrendAI Vision One™. These records include prompts, responses, and tool calls, each tied to a verified user. It enables security teams to investigate AI activity in context, correlate it with endpoint, identity, cloud and network signals, and build custom detections for relevant agent behaviour.
Commenting on the announcement, Salah Suleiman, Managing Director, South Gulf, TrendAI™, said, “AI is changing both how software is built and how work gets done across the enterprise. Code is being written faster than ever, while AI agents are increasingly able to access systems, call tools and act on behalf of users. As organisations across the UAE and the wider region scale AI at pace, their security teams need to identify vulnerabilities early while maintaining clear visibility into what AI systems are doing and whether their actions align with organisational policies. With these additions to TrendAI Vision One™, we are helping organisations move faster with AI while maintaining the context, oversight and control needed to do so securely.”
TrendAI Vision One™ also continues to ingest activity logs from Claude Enterprise, covering user logins, administrative actions and configuration changes, as well as from Claude Platform, covering administrative, system and resource events. Autonomous Vulnerability Discovery is now available in private preview to select enterprise customers running on AWS, while Claude’s Compliance API integration in TrendAI Vision One™ is available to TrendAI Vision One™ customers using Claude Enterprise.
Dr Ryad Soobhany, Deputy Academic Head of School of Mathematical & Computer Sciences, Heriot-Watt University Dubai

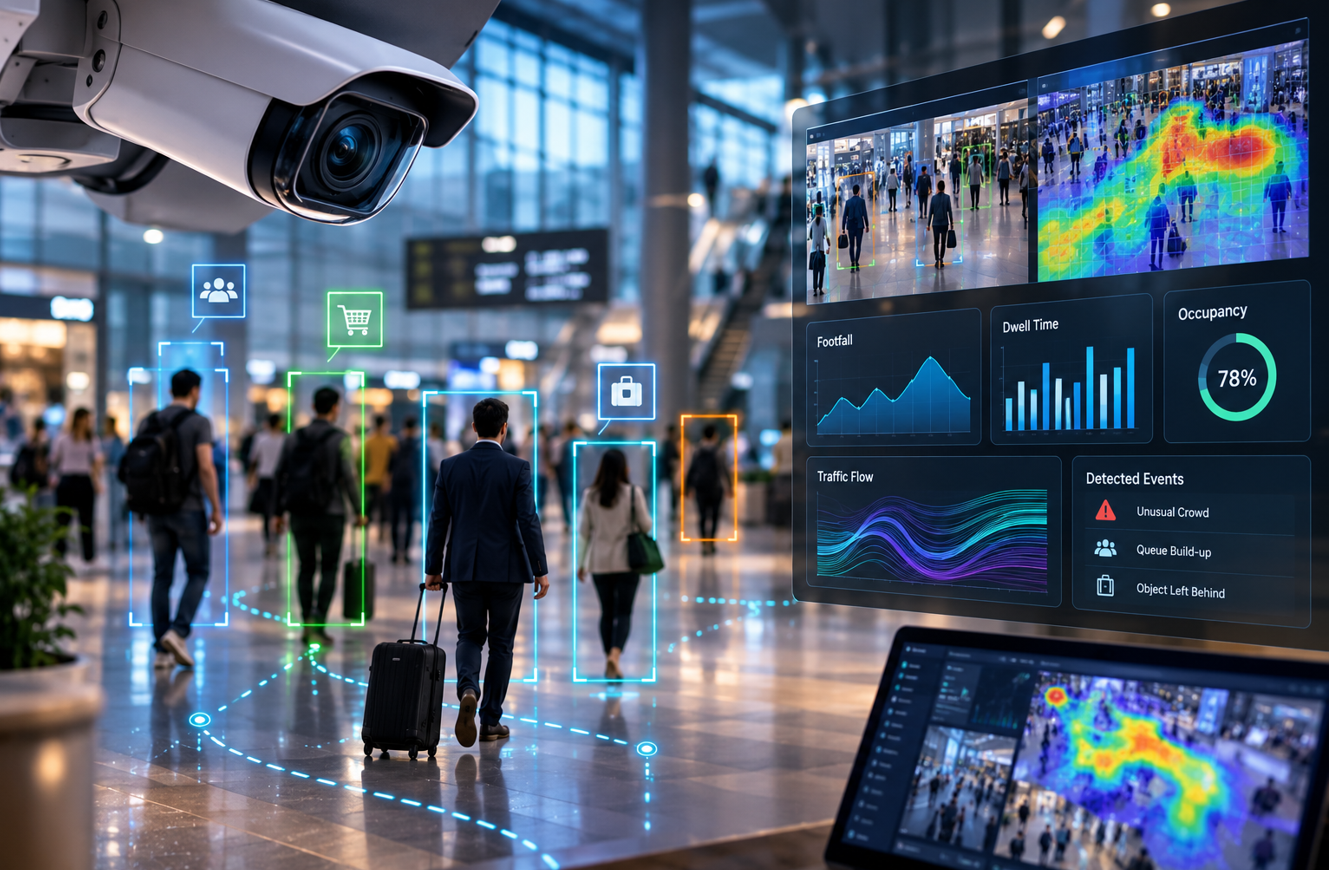
Camera systems, such as CCTV, are mainly used for video surveillance within organisations. Passive video surveillance has been part of the security ecosystem for years, providing organisations with the ability to monitor different areas simultaneously, while recorded footage can be inspected after an event occurs.
The evolution of computer chips and increased processing power has led to improved image quality, including better performance in low-light conditions, particularly at night. The advent of edge computing, with processing performed on edge devices within a network, has made object and scene recognition more readily accessible. This evolution has led to more active video surveillance through video analytics, where events can be identified and addressed in real time. Examples include number plate recognition systems and facial recognition for access control.
With the combination of AI and video data, computer vision can be integrated with business analytics to transform video surveillance from a security infrastructure into a business intelligence tool. Video surveillance is moving from passively recording events to sensing what is happening in the environment. This helps to answer questions such as which areas are congested, how customers are moving, how long they dwell in particular areas, and whether unusual events are occurring. Businesses can use this data to optimise their operations, such as improving the customer checkout process, monitoring asset or staff movement, and managing crowds or traffic flows. Organisations can also incorporate contextual business information to enhance the analytics by combining behavioural data with CRM or IoT data, providing additional context and insights for decision-making and improving the customer or visitor experience.
Video surveillance can be used to optimise operations, improve customer experiences, and support strategic decision-making across industries. Video itself does not create business intelligence; rather, its value increases when visual information is combined with other operational and contextual data, while computer vision is used to understand and enhance business operations. The pipeline from video to business intelligence can be represented as obtaining data from video sources such as fixed cameras, IoT-enabled cameras, or robots. Computer vision is then applied to the video to detect or track people, objects of interest, or activities. Behavioural data are taken into account, such as customer dwell time in particular product areas, occupancy of rooms or halls, movement of people across a building, and anomalies in behaviour. At this stage, operational data are also considered. The final stage is the business intelligence stage, where trends are identified and insights are inferred. At this stage, data visualisation plays an important role, with dashboards and data storytelling displaying correlations, predictions, and infographics that provide more than simple visual summaries of surveillance data. The camera becomes an operational sensor for the organisation. The important transformation occurs when visual data are combined with business data, such as sales, operational, and IoT data, to convert visual observations into business knowledge that informs operational, tactical, and strategic decision-making within an organisation.
The levels of business intelligence can be viewed as three analytical capabilities: descriptive intelligence, diagnostic intelligence, and combined predictive and prescriptive intelligence. Descriptive intelligence usually addresses what is happening. Visual analytics can identify footfall, occupancy, queue length, waiting time, dwell time, traffic flow, movement patterns, and detected events. Visualisation dashboards can present these indicators in real time or over historical periods, allowing managers to understand the current state of an operation. For example, a museum dashboard can show heat maps of visitor numbers, dwell time, and movement across different exhibition areas, while analysing visitor behaviour and providing insights into the optimal placement of exhibitions. An airport dashboard could display passenger volumes and queue lengths across terminals.


Submer to Address the Infrastructure Challenges Behind Sovereign AI at DCD Connect | MENA 2026
Terrace Dining, Oktoberfest, and Beach Days Return to InterContinental Abu Dhabi This October

THE STORIES BEHIND THE MATERIALS SHAPING UAE INTERIORS



-

 Trending12 months ago
OPPO A6 Pro 5G Review: Reliable Daily Driver
-

 Tech News2 years ago
Denodo Bolsters Executive Team by Hiring Christophe Culine as its Chief Revenue Officer
-
 VAR2 years ago
Microsoft Launches New Surface Copilot+ PCs for Business
-

 Automotive2 years ago
AGMC Launches the RIDDARA RD6 High Performance Fully Electric 4×4 Pickup
-
Tech Interviews3 years ago
Navigating the Cybersecurity Landscape in Hybrid Work Environments
-

 Hospitality2 years ago
Gulfood 2025 30th Edition Kicks Off Today, Setting New Benchmarks in F&B Growth and Innovation
-

 VAR11 months ago
Huawei Nova 14 Pro Review: Where Camera Excellence Meets Ecosystem Evolution
-

 Tech News1 year ago
Nothing Launches flagship Nothing Phone (3) and Headphone (1) in theme with the Iconic Museum of the Future in Dubai